
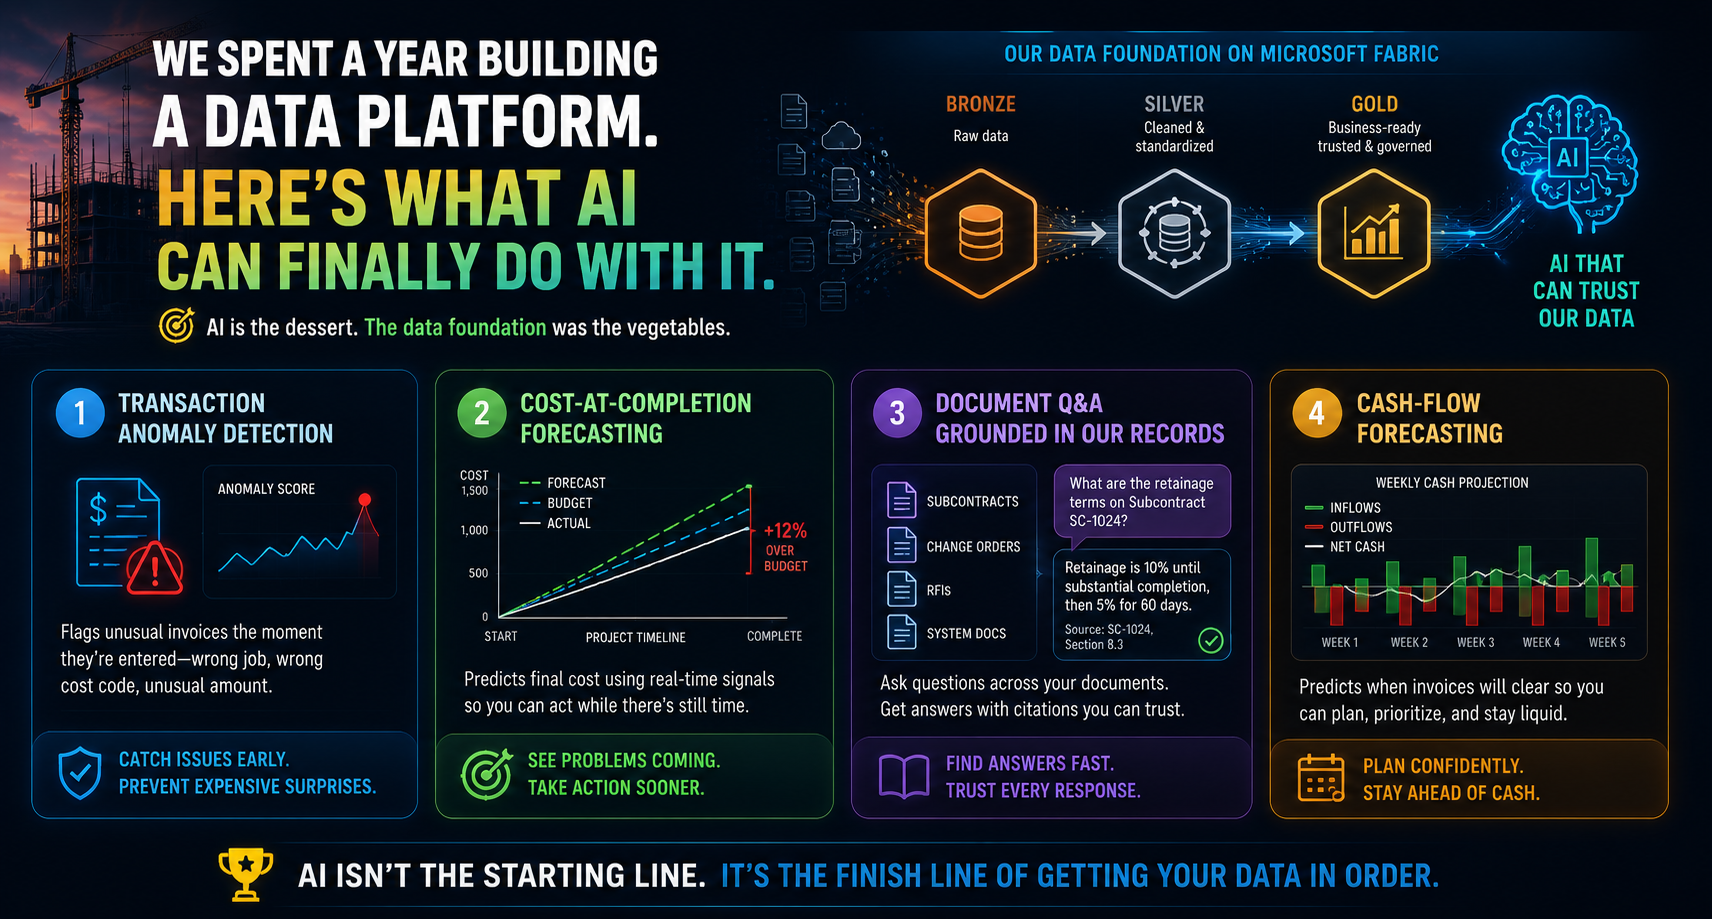
We spent a year building a data platform. Here’s what AI can finally do with it.
This article was originally published on LinkedIn and is archived here on texlytics.com.
Most construction firms that say they want “AI” don’t have data that AI can use. The accounting system doesn’t talk to the project management tool, half the operational truth lives in spreadsheets, and the same vendor is spelled three ways across three systems. Point the fanciest model on the market at that, and it will confidently produce nonsense — because it’s learning from a mess.
So before any of what follows, the boring part. We spent the better part of a year integrating our construction ERP and the systems around it into a medallion lakehouse on Microsoft Fabric: raw data in Bronze, cleaned and standardized in Silver, business-ready tables in Gold. It doesn’t demo well. But it’s the entire reason the roadmap below is realistic for us in 2026 rather than science fiction. AI is the dessert. The data foundation was the vegetables.
The first model won’t be AI. It’ll be a number.
Our first use case on the platform isn’t machine learning at all. It’s a governed measure in Fabric’s Gold layer: average days from invoice date to payment date, by company, division, and business partner.
Too simple to mention? The point is that we couldn’t answer it before. The invoice date lives in one ERP record, the payment date in another, one invoice can be settled across several payments, and the same business partner is identified differently from system to system. Pulling it together by hand produces a number that’s stale the moment it’s finished. Once the data is integrated, it becomes a single, always-current view. A simplified, illustrative example of the output:
| Company | Division | Business Partner | Avg Days (Invoice to Payment) | Invoices |
| Coastal Structures | Site Work | Delta Earthworks | 29 | 210 |
| Coastal Structures | Concrete | Hilltop Concrete | 31 | 142 |
| Coastal Structures | Steel | Cypress Steel | 44 | 88 |
| Coastal Structures | Mechanical | Apex Mechanical | 67 | 53 |
| Meridian Civil | Electrical | Sabine Electrical | 58 | 61 |
| Meridian Civil | Concrete | Hilltop Concrete | 92 | 47 |
Figures above are illustrative.
These are the patterns it surfaces. If the same vendor — say, Hilltop Concrete — is paid in 31 days under one company and 92 under another, that usually signals a stuck approval workflow or a souring relationship, the kind of thing that’s invisible today. A division sitting at 67 days while everything else clusters near 30 is worth a question.
It’s descriptive, not predictive, and that’s the point: it’s the baseline the models below will learn from. Once you know what normal looks like, you can flag what isn’t — and predict what’s coming.
1. Transaction anomaly detection
Technical: A classifier trained on historical AP/AR transactions that learns normal relationships — which vendors map to which cost codes, typical amounts, how invoices flow against a job — and scores each new transaction for how far it deviates.
In plain terms: A second set of eyes on every invoice the day it’s entered. A $48k bill coded to a job that closed months ago, or a concrete vendor’s invoice landing on an electrical cost code, gets flagged immediately — the way your bank texts you about a charge that doesn’t fit. It doesn’t decide; it makes sure a human looks before it hits the books.
2. Cost-at-completion forecasting
Technical: A regression model predicting a job’s final cost from in-progress signals — committed costs, percent complete, change-order velocity, burn rate by phase — with a confidence range rather than a single false-precision number.
In plain terms: It tells you a job is heading over budget while you can still do something about it. Three months into a nine-month job, before it’s obvious in the reports, the model says “this is trending about 12% over.” Like a GPS recalculating your arrival time as traffic builds, it gives a project manager’s judgment a few weeks’ head start.
3. Document Q&A grounded in our own records
Technical: Retrieval-augmented generation (RAG) over our subcontracts, change orders, RFIs, and system documentation, indexed so a model searches by meaning and answers only from the retrieved passages, citing each source.
In plain terms: Someone who has read every document the company owns, never forgets where anything is, and shows the receipt. Instead of opening forty PDFs for the retainage terms on one subcontract, you ask and get an answer pointing to the exact clause. Because it can only answer from real documents and cites them, it’s auditable — which is what makes finance trust it.
4. Cash-flow forecasting
Technical: A regression model predicting when each open invoice will actually clear — from the partner’s payment history, division, amount, approval stage, and the days-to-pay distribution we already measure — rolled up into a weekly cash projection.
In plain terms: A weather forecast for the bank account. Remember that first number, days to pay? This is what it grows into. An aging report tells you what you owe and are owed; this tells you when it will actually move, which customers are likely to pay late so you can chase early, and how to time payments without straining a vendor.
The point
None of these four is exotic. Classification, regression, and document retrieval are well understood. What makes them achievable isn’t a breakthrough in AI; it’s that the data underneath is finally integrated, consistent, and trustworthy.
AI isn’t the starting line. For most firms it’s the finish line of a quieter race — the one where you get your data in order first. Do that work, and “AI for construction finance” stops being a buzzword and becomes a roadmap.
That’s what we’re building toward this year. Happy to compare notes with anyone walking the same road.